Anne Berger, Benjamin Strehle, Tanja Zünd, David Schreiner, Hubert A. Gasteiger “Technical University Of Munich, Tum School Of Natural Sciences, Department Of Chemistry And Catalysis Research Center, Chair Of Technical Electrochemistry, D-85748 Garching, Germany” For Anne Berger, Benjamin Strehle, Tanja Zünd And Hubert A. Gasteiger And Institute For Machine Tools And Industrial Management, Technical University Of Munich, D-85748 Garching, Germany For David Schreiner
Introduction
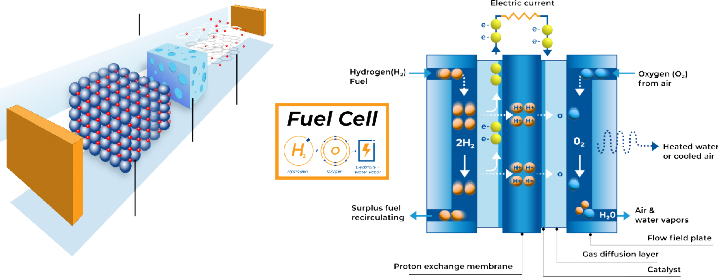
With the current need to shift from fossil fuels to renewable energies, alternatives to internal combustion engines for transportation are needed. For short range transportation, battery electric vehicles powered by lithium-ion batteries (LIBs) have reached a wide acceptance, while for long range transportation or for heavy duty applications (i.e. trucks, ships, trains), fuel cell electric vehicles based on proton exchange membrane fuel cells (PEMFCs) are foreseen to play a major role.[1-2] Mercury intrusion porosimetry (MIP) can be a powerful technique to characterize battery and fuel cell materials, which can aid materials optimization and lead to solutions for current issues in terms of energy density and durability.
This article is designed to be a technical guide with practical strategies to use mercury intrusion porosimetry for the characterization and subsequent optimization of battery and fuel cell materials. Increasing the volumetric energy density and thus the range of battery electric vehicles is one of the major goals of current R&D efforts. One approach is to compress the battery electrodes into a thinner layer, which among other advantages[3] results in the same energy stored in a reduced volume. However, there are limitations to the compression: one is determined by the densest possible packing of the approximate spherical active material particles (in the μm range) and the other is set by their internal porosity (in the nm range). MIP is a powerful method to quantify and separate the porosities of these different pore size regimes. This guide will highlight how to properly examine electrode porosities and the advantages of characterizing the morphology of the active material powder prior to electrode fabrication. In fuel cell applications, the mass transport of reactants and products is dominated by diffusion processes, which are governed by the porous networks in the electrodes and the so-called gas diffusion medium. Here, MIP is already an established method and differences in total porosity and pore size distribution have been linked with the achieved cell performance.[4-5] This article illustrates the aspects that have to be considered in order to avoid measurement artifacts.
Using Mercury Intrusion Porosimetry in Battery Research
Cathode electrodes commonly consist of the cathode active material (CAM) to which small amounts of conductive carbon and a polymer binder are added. Figure 1 shows a sketch of the electrode structure: the large particles in blue represent the cathode active material (CAM) particles, while the small black spheres represent the conductive carbon; the polymer binder is illustrated in gray. While some CAMs do not have any internal porosity, many do have an elaborate porous network inside the particles and thus a significant internal porosity. Therefore, we would like to distinguish between the inter-particular volume between the CAM particles in the electrode structure and the intra-particular volume inside the CAM particles. The sketch in Figure 1 shows these intra-particular pores in a very simplified and enlarged representation. As the intra-particular pore volume is contained in pore size domains that are significantly smaller than the pore size domains that contain the inter-particular pore volume, the two regimes can be clearly separated by mercury intrusion porosimetry, so that a detailed analysis of the porosity values in the two regimes is possible. For a typical LIB cathode, the electrode is composed of the CAM, a carbon black (CB, serving as conductive carbon) additive, and a polymeric binder (in this case PVdF). The components are included in the sketch in Figure 1 (not to scale).
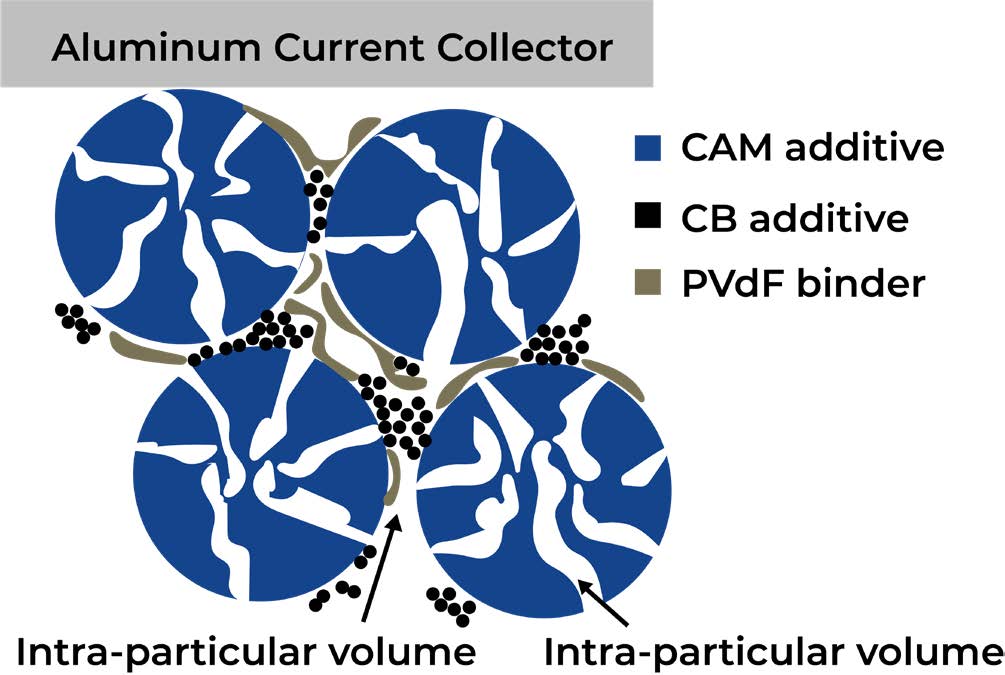
Figure 1. Sketch of the cathode electrode structure obtained with a porous cathode active material. The CAM particles depicted in blue are perforated with an extensive network of pores. Carbon black additive is marked in black and PVdF binder in gray. The electrode structure is supported on an aluminum foil that serves as a current collector. The representation of particle and pore sizes is not to scale.
In the first step, using MIP data, we would like to summarize three different methods to calculate the electrode porosity.
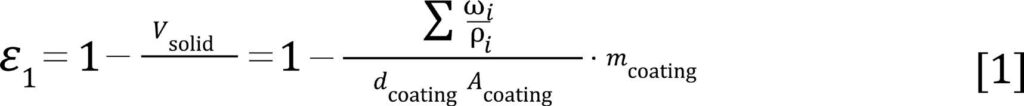
Figure 2 shows the pore size distribution for electrodes containing two different CAMs, one with and one without intra-particular porosity, at three different nominal compression ratios.[6] For the overall electrode porosity analysis, we would like to focus exemplarily on an electrode prepared with an NCA (LiNixCoyAlzO2, with x + y + z = 1) CAM. The electrodes were compressed using several calendering steps. The nominal porosity (ε1) was determined by measuring the coating thickness dcoating and the coating mass mcoating for a defined area Acoating, for a given composition (weight fractions ωi and skeletal density ρi of all components i):
This nominal porosity ε1 can be compared with the porosity determined in two ways from mercury intrusion porosimetry. As, in the following, the weight fraction of the aluminum current collector ωAl needs to be separated from the weight of the coating, the following conversion can be used:
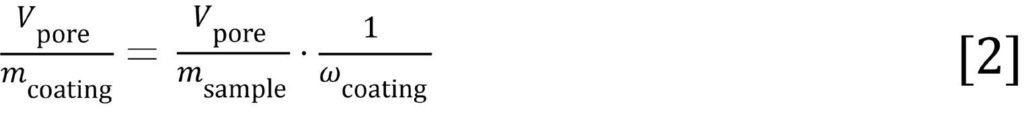
With the absolute pore volume Vpore in mL, the mass of the coating mcoating, the mass of the sample msample, and the weight fraction of the coating wcoating = mcoating / msample, the porosity of the coating can be calculated by using the bulk sample density ρbulk,sample, which is determined by the instrument at very low pressures (e.g., the filling pressure) by comparing the sample volume with the calibrated volume of the penetrometer, using the following equation:
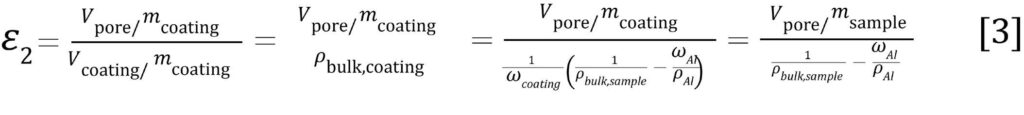
The porosities determined by this method agree well with the nominal porosities obtained via Eq. 1. For example, the NCA electrode porosities determined with MIP via Eq. 3 yield 45%, 40%, and 31% for the three investigated calendering steps, which are in good agreement with the nominal porosities of 47%, 42%, and 32% that are obtained via Eq. 1.
A different way to determine the electrode porosities relies on prior knowledge of the skeletal density of the individual components. The skeletal density can be easily determined via gas pycnometry. Instead of the skeletal density, the crystallographic density can be used for cathode active materials as an approximation, as it is very close to the skeletal density. The crystallographic density can be extracted by X-ray diffraction (XRD) measurements. The porosity can then be calculated as:
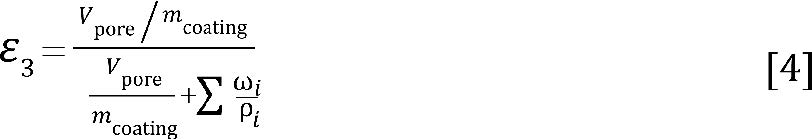
with ρi being the skeletal density or the crystallographic density for the CAM as an approximation.
Table 1. Weight fraction and skeletal/crystallographic densities of the materials that are incorporated in the NCA (LiNixCoyAlzO2, with x + y + z = 1) and the Li- and Mn-rich (LMR-NCM; Li1+δ[NixCoyMnz]1−δO2, with x + y + z = 1 and δ ≈ 0.1–0.2) electrodes.[6]
| ω [%] | ρ [g/cm3] | |
|---|---|---|
| LMR-NCM | 92.5 | 4.35 |
| NCA | 92.5 | 4.65 |
| CB | 4.0 | 2.0 |
| PVdF | 3.5 | 1.76 |
When using Eq. 4 and the coating parameters from Table 1, the porosities obtained for the three differently calendered NCA electrodes are 45%, 41%, and 34%. These values agree well with the above obtained nominal porosities (47%, 42%, 32%) and the porosities determined with Eq. 3 (45%, 40%, 31%). A summary of the porosity values of the differently calendered NCA electrodes, determined by either Eq. 1, Eq. 3, or Eq. 4 can be found in Table 2.
Table 2. Summary of the porosity values for the differently calendered NCA electrodes as determined by the three different methods described above.
| ε1 (Eq. 1) | ε2 (Eq. 3) | ε3 (Eq. 4) | |
|---|---|---|---|
| Light calendering | 47% | 45% | 45% |
| Medium calendering | 42% | 40% | 41% |
| Strong calendering | 32% | 31% | 34% |
After having established three different methods to quantify the overall porosity of the electrodes, mercury intrusion porosimetry allows a detailed analysis of the pore volume in different pore size regimes. When looking at Figure 2, three distinct pore regimes are visible, as indicated with the numbers ①-③. The pore size boundaries of the different pore regimes are defined depending on the material. Regime ③ shows the ntra-particular volume at pore sizes between 3.6 nm (lower limit of MIP) and 240 nm. Regime ② marks the inter-particular volume between the CAM particles in the electrode structure. Regime ①, however, is more difficult to interpret, as it stems from a measurement artifact. To achieve the required sample pore volume for a sufficient stem usage (25-90%), it is necessary to add several layers of the electrode material to the penetrometer (in our case 15-25 pieces of ≈2-2.5 cm² double-side coated electrode pieces per penetrometer). However, the volume created between these layers is intruded with mercury and is clearly not due to the porosity of the electrode. The large error bars in regime ① support the conclusion that it is not a representative material property. Fortunately, in this example, the pore size region of interest is clearly separated from regime ①. How to deal with the effect of intruded mercury volume when the regime of volume between the layers overlaps with the region of interest is elaborated later in this article when discussing fuel cell gas diffusion layers.
Regime ② represents the inter-particular porosity, where the two here examined cathode active materials behave differently upon calendering. The so-called lithium- and manganese-rich nickel-cobalt-manganese oxide (LMR-NCM) has a substantial intra-particular porosity, quite different from the non-porous NCA CAM.
While pore volume and the pore diameter of the latter does not change significantly upon compression, the pore volume and pore diameter of the porous LMR-NCM material decreases substantially with stronger calendaring.
When looking at the intra-particular pore size distribution (regime ③) of the uncalendered materials, the LMR-NCM has two peaks: one at 40–70 nm, which is attributed to the internal porosity of the CAM, and one at 130 nm, which correlates to pores within the conductive carbon. At the latter pore size of the conductive carbon, a small peak is visible for the NCA CAM electrode, but no other internal porosity attributable to internal CAM porosity is visible. The internal porosity for the LMR-NCM particles can be calculated by using the intruded volume of mercury at this specific pore region vpore.
By using the electrode specifications given in Table 1 and with a volume of intruded mercury of 80 mm³/g, the intra-particular porosity amounts to 24% (referenced to the CAM particle volume). As the area under the curve scales with the volume in this pore region in this representation (log differential volume versus the logarithm of the pore size), the pore volume of the LMR-NCM material is not decreased upon calendering, but even increases in regime ③ (intra-particular volume). This increase is unexpected and suggests a structural change in the CAM that allows more pores to be accessible.
However, as the intra-particular volume is not reduced during calendering, the limit of decreasing the porosity by compressing is set by the internal porosity of the active material. The theoretical limit of the compaction of the inter-particular volume is fixed by the close-packing of equal spheres unless these spherical particles were to break. Given that the intra-particular porosity of the active material is already at 24% and, as an approximation, that the lowest porosity for single-diameter spherical particles is 26%, a nominal compaction of 31% is physically not possible unless a deformation or particle crack occurs. This conclusion explains the observation of severe embossing of the aluminum foil at this high compression.[6]
A detailed interpretation of the MIP results for LMR-NCM and NCA battery electrodes can be found in reference [6].
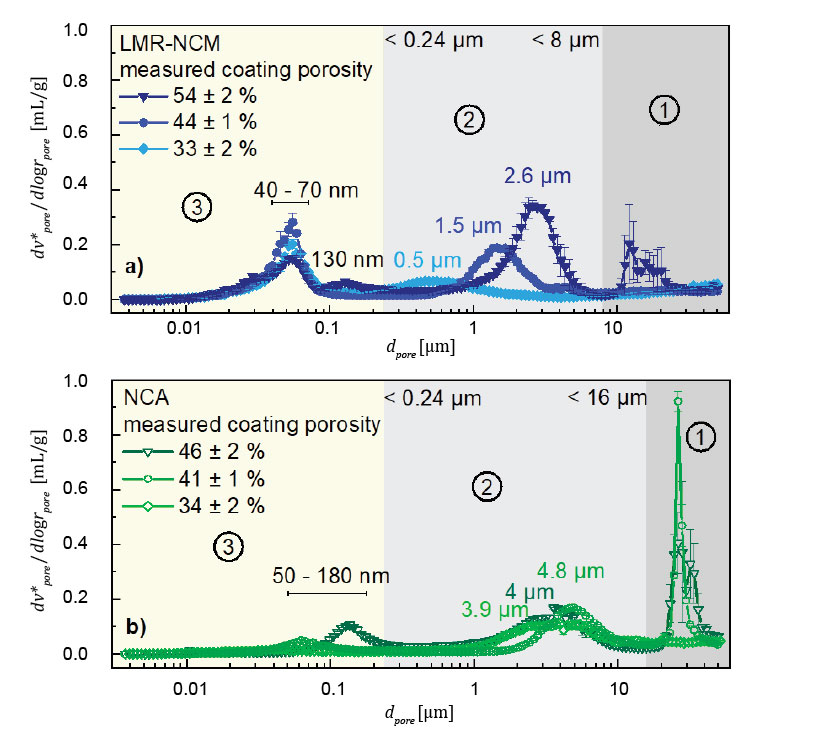
Figure 2. Pore size distributions (log. differential volume versus the pore size on a logarithmic scale) of uncalendered and calendered electrodes (the error bars represent the standard deviation of 3 repeat measurements): a) prepared with an LMR-NCM CAM that exhibits an intra-particular porosity; b) prepared with an NCA CAM that has no intra-particular porosity. Three regimes can be separated: ① filling in between sheets, ② filling of inter-particular pores, and ③ filling of intra-particular pores. The figure is adapted from reference [6].
As described in the previous paragraph, the intra-particular porosity can already give an estimation of the maximum achievable degree of compaction of an electrode. To optimize the cathode active material already in the early stages of its development in terms of its theoretically achievable energy density in an electrode, determining the intra-particular porosity of the CAM in powder form is a promising screening technique.[7]
Figure 3 illustrates the MIP results of two different LMR-NCM powders. As with the electrodes, three different regimes can be separated. Region ① represents a continuous increase of intruded mercury volume into larger pores (≥ 4 μm), which can be attributed to particle rearrangement and compaction. When increasing the pressure to regime ②, the volume between the particles is filled. Regime ③ represents the intra-particular volume (< 300 nm).
One potential difficulty with measuring CAM powders is already visible in regime ①. In this measurement, the powder was added loosely to the penetrometer. When increasing the pressure, the particles rearrange to a denser packing. Depending on the properties of the material, the compaction of the particles upon compression might already require the entire volume of mercury in the stem. Consequently, a further evaluation of the region of interest is not possible anymore. As a solution, one can either increase the mercury filling pressure, which causes some of the particle rearrangement to already take place during mercury filling without using up stem volume. In this measurement, a filling to 1 psi (69 mbar) was sufficient, but a proper filling pressure needs to be adjusted for the powder properties. Another solution to avoid stem depletion during regime ① is to compress the powder to a pellet prior to the measurement.
In regime ②, mercury fills the volume in between the CAM particles. The pore diameter is a function of the particle size and the packing structure. Giesche et al. have reported a rule of thumb that the pore diameter in between densely packed and approximately spherical particles is ~25–50% of the particle diameter, which is also satisfied in our example (D50 values of ~6 μm).[8]
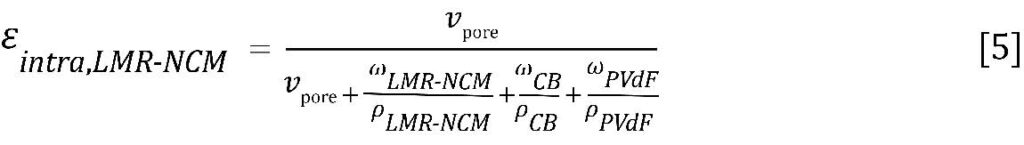
Finally, regime ③ is the region of interest where the intra-particular volume is filled. It can be observed that the porous material (“P-woCo-6” in reference [7]) possesses internal porosity within the particles, while the dense material (“D-woCo-6” in reference [7]) does not show pore volume at smaller pores. By analogy with the electrode coatings discussed above, the internal porosity can be assessed with Eq. 5. However, as only the active material is analyzed, i.e., without any binder or conductive carbon, the formula simplifies to:
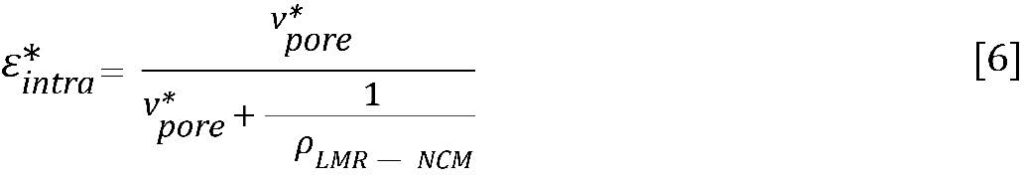
With a crystallographic density of ρLMR–NCM = 4.35 g/cm³ and a determined pore volume of vpore* = 44 mm³/g (referenced to LMR-NCM volume and weight), the internal porosity amounts to ~16% for the inherently porous CAM.
In the next step, we would like to estimate from the measurement of the porous LMR-NCM CAM powder the achievable LMR-NCM electrode density, which scales linearly with the energy density. To convert εintra* (on the powder level) to εintra (on the electrode level), using the electrode components and composition given in Table 1, the following equation (adapted from Eq. 5) can be applied:
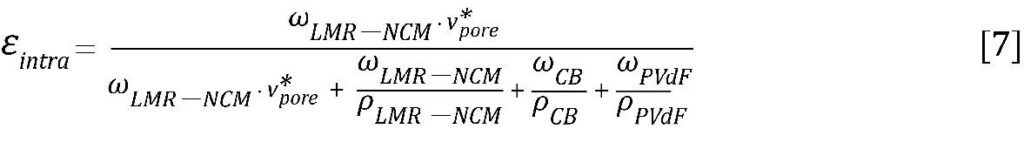
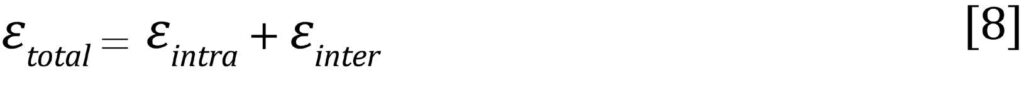
If one now assumes that the lowest achievable εinter value corresponds to that of a closest packing of single-diameter spheres, namely to εintra ≈ 26%, a calendering to a porosity of ~40% would not be possible without significant breakage of the LMR-NCM particles.
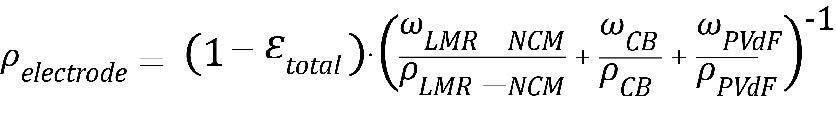
From the total porosity εtotal, the best-case electrode density ρelectrode can then be approximated
The complete interpretation of the MIP results for the cathode active material powders can be found in reference [7].
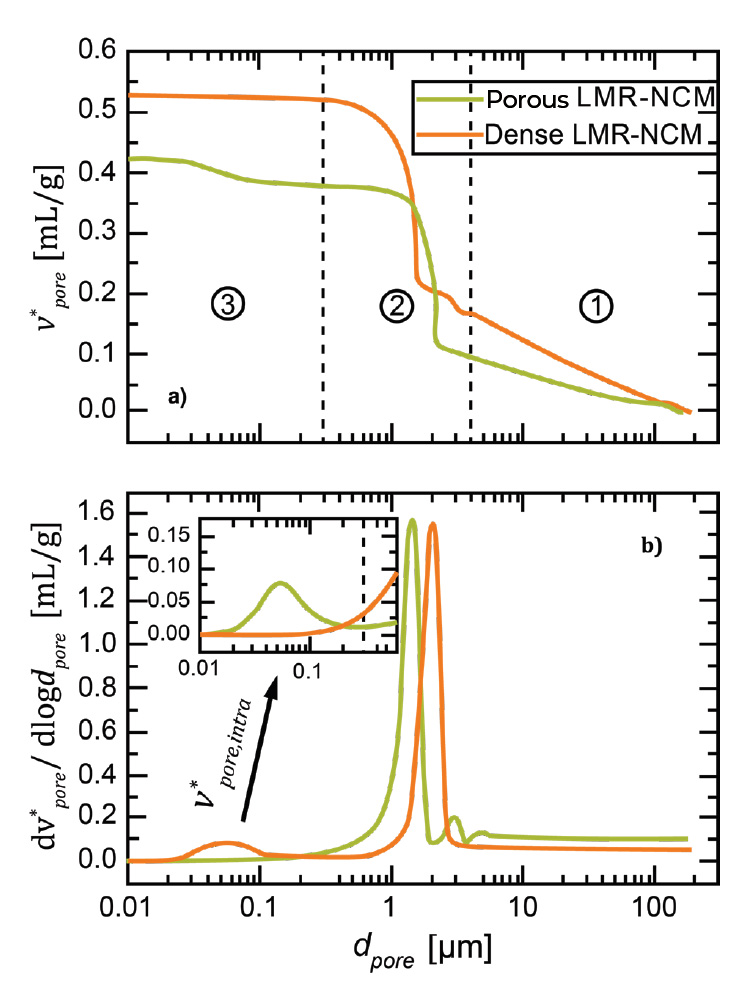
Figure 3. Mercury intrusion porosimetry of CAM powders. a) Cumulative pore volume and b) log differential pore volume as a function of the pore diameter on a logarithmic scale. Three regimes can be separated: ① powder compaction, ② filling of inter-particular pores, and ③ filling of intra-particular pores. The figure was adapted from reference [7].
Using mercury intrusion porosimetry in fuel cell research
Diffusion processes dominate the mass transport in PEM fuel cells, especially on the cathode side when oxygen is supplied by feeding air to the fuel cell. In this case, the transport of oxygen reactant to the cathode electrode (in the gas phase) and the removal of product water from the cathode electrode (in the gas and/or liquid phase) can impose significant mass transport resistances that compromise the performance of state-of-the-art PEM fuel cells. The gas diffusion layer (GDL) facilitates the equal distribution of oxygen and water across the active area of the cathode electrode, and its material properties have been characterized widely in the literature and have been directly linked to the PEM fuel cell performance. Among many properties, porosity and pore size distribution are important descriptors of a GDL and thus mercury intrusion porosimetry has been used frequently to characterize GDLs.
As in the above described mercury intrusion porosimetry studies of battery electrodes, several layers of the GDL have to be added to the penetrometer to achieve a sufficient stem usage. However, the stacking of layers creates extra volume in between the layers, which leads to measurement artifacts. The way the layers are stacked in the penetrometer highly affects the analyzed pore sizes at the interface as well as the overall porosity. Figure 4a shows the impact of the orientation of the GDL during the measurement. The GDL usually consist of a ~150-250 µm thick GDL-substrate (GDL-S) with larger pores of 10-30 µm and a ~20-50µm thick microporous layer (MPL) with po- res on the order of 70-1000 nm. The upper panel of Figure 4a shows the cumulative intrusion, while the lower panel illustrates the pore size distribution in form of the log differential intrusion for three different stacking configurations as sketched in the inset of Figure 4a. When the GDL-S sides are facing and the MPLs are oriented towards the outside (orange line), the highest pore size of approximately 30 µm was reached. Howe- ver, when the MPLs are facing and the GDL-S sides face outwards (blue line), the peak is shifted by 10 µm to 20 µm. Not only the pore size is different between the two sta- cking configurations, but also the cumulative intrusion shows different intruded volume in this pore range leading to different overall porosities. The additional volume at these larger pores for the “GDL-S facing” configuration can be attributed to an extra volume between the GDL layers, which is formed by the surface roughness of the fibrous network. As the two layers are pressed against one another, the interface creates larger pores, which are measurable by mercury intrusion porosimetry.
Figure 4c shows a sketch of the proposed pathway of mercury into the structure for the three configurations listed in panel a. In the “MPL facing” configuration, the mercury can intrude unaltered from both faces preferably in through-plane direction. In contrast, the mercury intrudes in the “GDL-S facing” configuration into the large spaces in between the sheets first and mostly intrudes the remaining structure from there. Therefore, GDLs with MPLs can be stacked, but only with the MPLs facing. The smooth surface of the MPL decreases the interfacial error.
Figure 4a additionally contains the results for a continuous stacking of GDL-S/MPL/ GDL-S/MPL. It can be observed that this method also creates artifacts. When two GDL-S+MPLs were stacked on top of each other, one fibrous GDL substrate was intruded perpendicular from the side, while one was intruded by the edge faces
(see sketch in Figure 4c). Therefore, the intruded volume at the peak from the “MPL facing”-curve at 20 µm is approximately half for the “Stacked”-curve compared to the “MPL facing”-curve. The main peak is shifted to even smaller pores at 15 µm, which is due to constriction effects of the in-plane porous network: when the GDL is intruded partially from the edge, the pathway to intrude all the pores is longer, which increases the importance of constrictions along the way. Additionally, it is known that certain GDL-S materials are anisotropic, which means that their in-plane and through-plane porous network might differ. [9]
Additionally, it can be observed that the MPL facing method does not have a negative effect on the pore size distribution and porosity of the MPL itself (<5µm): all three stacking methods result in exactly the same MPL pore sizes and porosities as the curves in the log differential intrusion plot overlay perfectly. The pore size of the MPL is 1-2 orders of magnitude smaller than the pores of the GDL-S. Thus, the ratio of layer thickness to pore size is larger for the MPL than for the GDL-S, meaning that the change in geometry by either penetrating through-plane or from the side in-plane is not significant. Constrictions already play a significant role when measuring the MPL,
independent of the penetration pathway. Additionally, the structure of the MPL is more isotropic and thus, no significant differences are expected between the in-plane and through-plane behavior.[10]
When there is no MPL coated onto the GDL-S, one can obviously not simply stack the MPL sides together. In Figure 4b, 1 GDL-S without stacking (stem volume use: 17% of 0.392 mL stem) is compared to two GDL-S with stacking (stem volume use: 36% of 0.392 mL stem). Similarly to the “MPL facing” and “GDL-S facing” experiment, the shift to higher pore sizes as well as the increased volume at the interface region is visible. The increase in porosity by the artifact caused by the stacking of the materials was determined to be 3% when only two layers are stacked. The error is likely to increase with more stacked layers. A comparison of the pore size distribution around the largest pores for the “1 GDL-S” measurement in Figure 4b with that of the “MPL facing” experiment in Figure 4a shows that they are essentially identical, both with regards to peak form and pore radius. Hence, the “MPL facing” method can be applied to achieve representative measurements of a GDL-S.
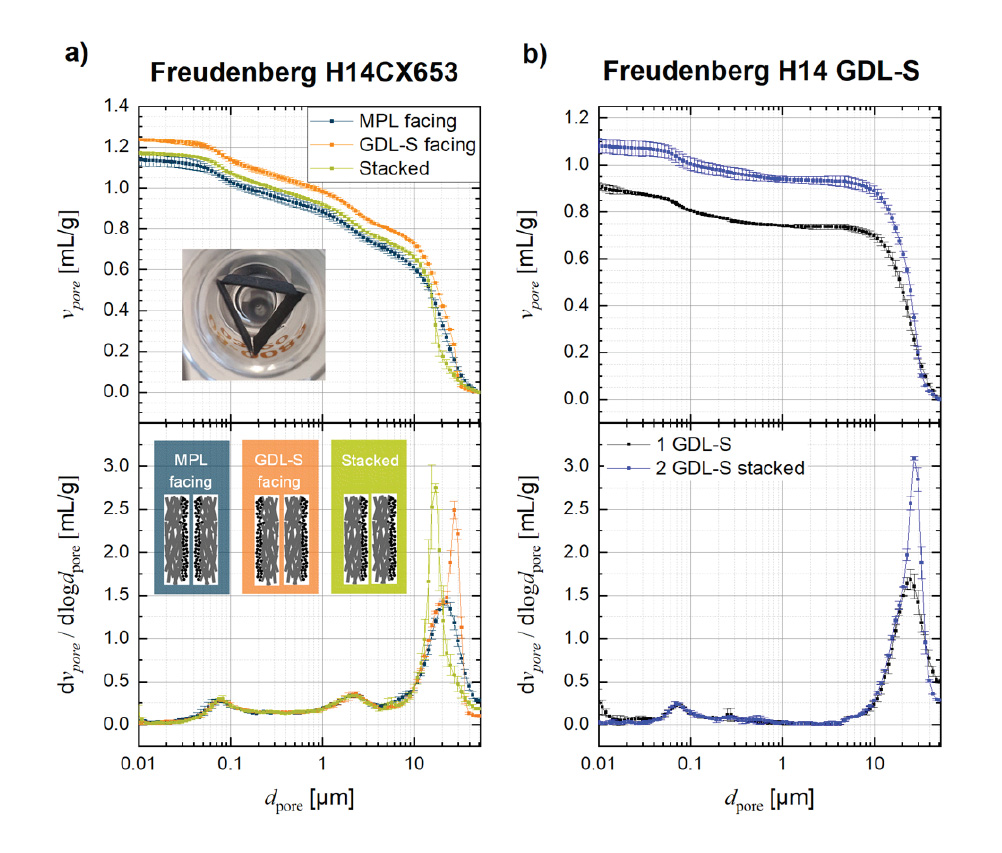
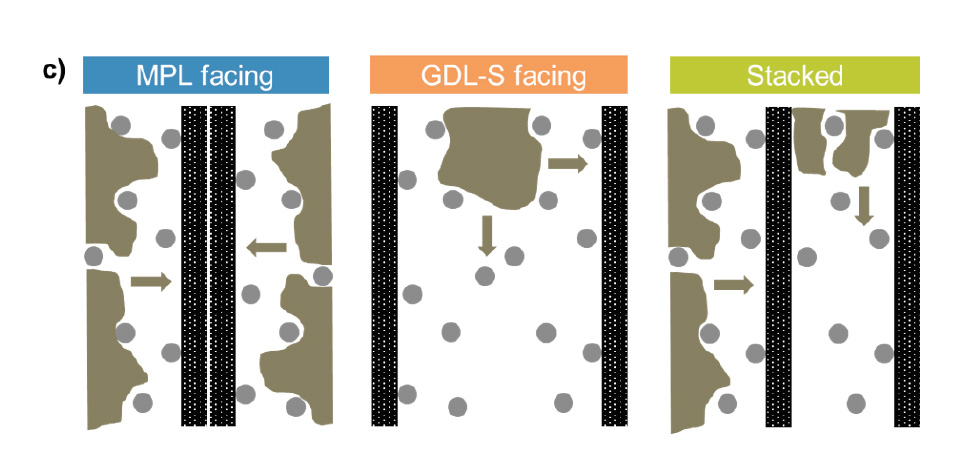
Figure 4. Cumulative (upper panel) and log differential intrusion (lower panel) for MIP measurements on a GDL-substrate (GDL-S) with or without a microporous layer (MPL): a) three different stacking configurations for an MPL/GDL-S; b) comparison of MIP data obtained with either 1 single GDL-S or 2 stacked GDL-S pieces. The error bars represent the standard deviation from 2 independent measurements. c) Sketch of the proposed mercury intrusion pathways into the structure for all configurations of panel a, with the gray circles representing the GDL-S fibers and the black hatched area the MPL phase: While the mercury (sketched in brown) can enter unaltered at many entran- ce points perpendicular into the GDL-S for the MPL-facing configuration, the mercury fills the large interfacial gaps first for the GDL-S facing configuration. The stacked configuration fills one GDL-S perpendicular and one GDL-S from the edge faces.
Conclusion
In summary, mercury intrusion porosimetry is a powerful tool to screen cathode active materials for lithium-ion batteries and gas diffusion layers used in PEM fuel cells and electrolyzers (not shown). In battery development, cathode active material powders can be analyzed already in early points of the development to quantify their internal porosity, from which the maximum electrode density upon electrode compaction can be projected. In addition, the inter-particular volume of electrode structures can be comprehensively analyzed in order to increase the understanding of the structural parameters of battery electrodes. In fuel cell research, mercury intrusion porosimetry is already an established technique to study gas diffusion layers and to estimate the mass transport behavior in PEM fuel cells. However, stacking several GDL sheets can lead to artifacts in pore size distribution and overall porosity. Hence, for GDL-S without an MPL, a stacking leads to these uncorrectable artifacts. For GDLs containing an MPL, there is a preferred way of stacking two sheets if a stacking cannot be avoided (i.e., if the pore volume of a single sheet is too low for an accurate MIP measurement).
- O. Gröger, H. A. Gasteiger, J.-P. Suchsland, J. Electrochem. Soc 2015, 162, A2605-A2622.
- D. A. Cullen, K. C. Neyerlin, R. K. Ahluwalia, R. Mukundan, K. L. More, R. L. Borup, A. Z. Weber, D. J. Myers, A. Kusoglu, Nat. Energy 2021, 6, 462-474.
- H. Zheng, L. Tan, G. Liu, X. Song, V. S. Battaglia, J. Power Sources 2012, 208, 52-57.
- I. V. Zenyuk, D. Y. Parkinson, L. G. Connolly, A. Z. Weber, J. Power Sources 2016, 328, 364- 376.
- C. Simon, D. Kartouzian, D. Müller, F. Wilhelm, H. A. Gasteiger, J. Electrochem. Soc 2017, 164, F1697-F1711.
- D. Schreiner, T. Zünd, F. J. Günter, L. Kraft, B. Stumper, F. Linsenmann, M. Schüßler, R. Wilhelm, A. Jossen, G. Reinhart, H. A. Gasteiger, J. Electrochem. Soc 2021, 168, 030507.
- B. Strehle, J. Yoon, F. Friedrich, H. A. Gasteiger, J. Electrochem. Soc 2022, 169, 060521.
- H. Giesche, Part Part Syst Charact 2006, 23, 9-19.
- H. Xu, M. Bührer, F. Marone, T. J. Schmidt, F. N. Büchi, J. Eller, J. Electrochem. Soc 2021, 168, 074505.
- M. Bozzetti, A. Berger, R. Girod, Y.-C. Chen, F. N. Büchi, H. A. Gasteiger, V. Tileli, Chem comm 2022, 58, 8854-8857.


