Introduction
The ASAP 2020 Chemisorption instrument can be used for many different analyses. One of the uses of the 2020 can be to analyze the chemisorption of hydrogen onto supported metal catalysts. In this study, 5 weight % palladium on activated carbon was used. During chemisorption, the bonds between H2 molecules dissociate on the metal and the individual hydrogen atoms chemically bond to the surface atoms of the palladium1. As the hydrogen bonds to the surface of the metal, the 2020 measures the quantity of hydrogen adsorbed at certain pressures. In this study, a wide range of pressures were employed, ranging from 0.01 mmHg to 500 mmHg. A detailed activation procedure is given in Table 1.
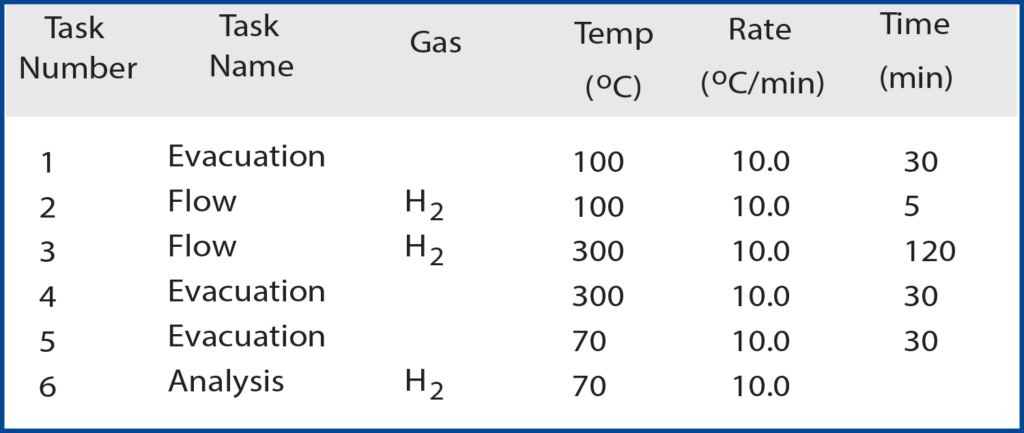
The palladium is reduced in flowing H2 to produce a clean catalytically active surface. This removes all impurities from the sample that would produce unwanted effects on the hydrogen adsorption. The analysis is ready to begin when the pressure in the sample tube has been held at or below 10 μmHg for 30 minutes. To acquire the quantity adsorbed at the low pressures, very small volumes of hydrogen are dosed to the sample via the ASAP 2020’s low pressure dosing option.
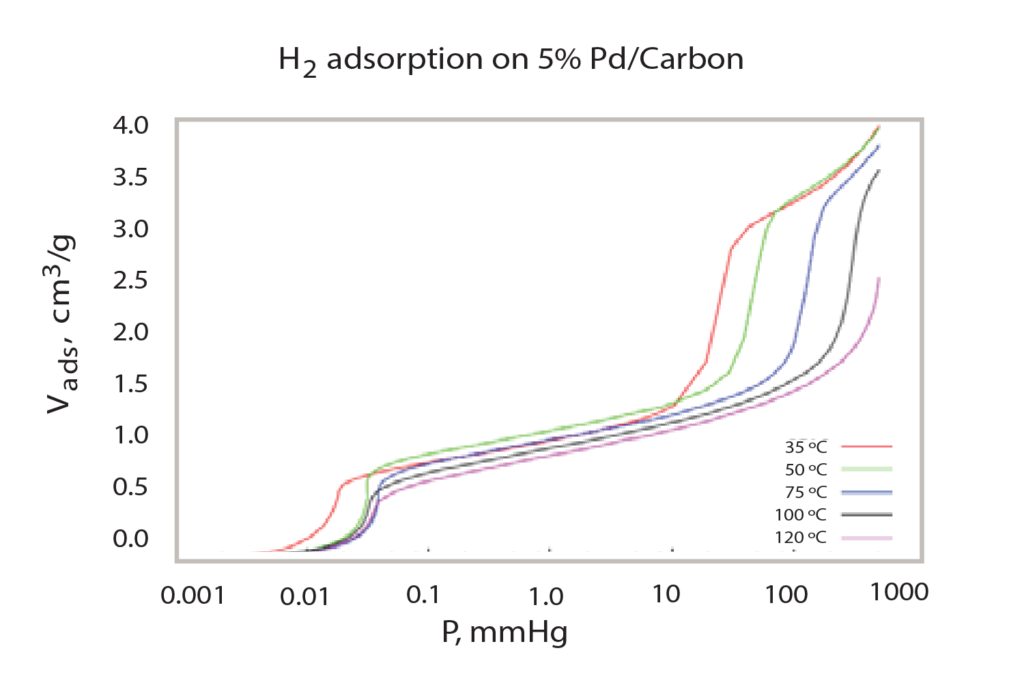
This provides a detailed chemisorption isotherm in low pressure (< mmHg). This occurs until all low-pressure data points are acquired and then larger volumes of hydrogen are dosed to create the higher pressure environment for the sample. The overall analysis is performed at multiple temperatures, ranging from 35 ºC to 120 ºC. The varying temperatures cause different quantities of hydrogen to be adsorbed onto the sample at specific pressures. As the temperature of the sample increases, the shape of the isotherm changes and less hydrogen is adsorbed as temperature is increased.
Results
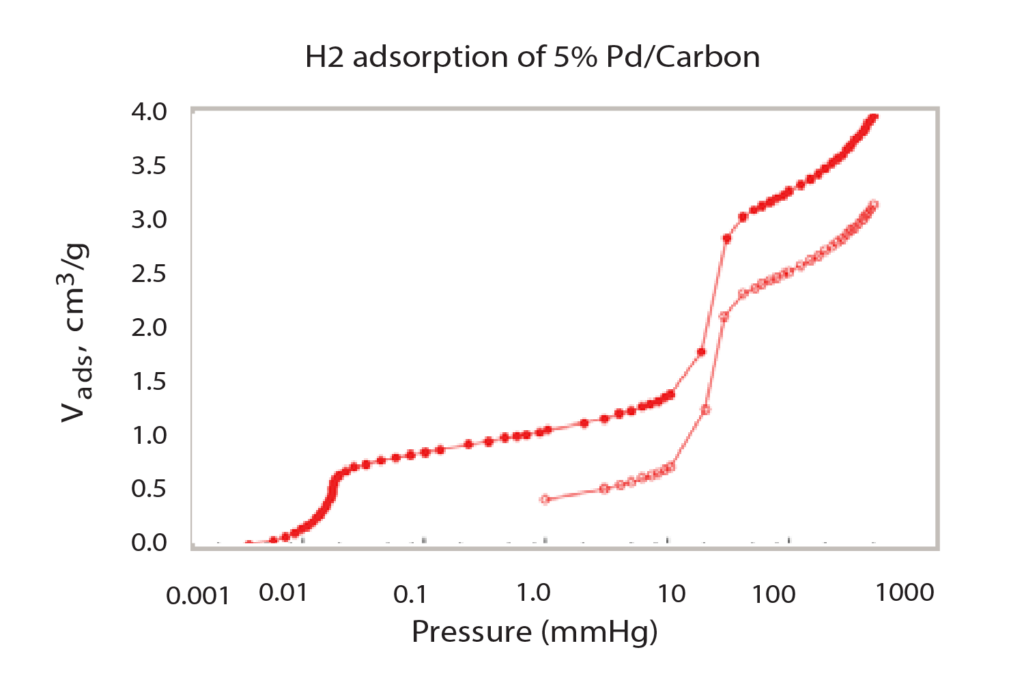
As seen in Figure 1, the isotherm forms two major steps with a plateau between them. A majority of the total hydrogen chemisorption occurs in these two narrow pressure ranges. The low-pressure adsorption, below 0.1 mmHg is the first major adsorption step; this is where the first layer of hydrogen is bonded to the surface of the palladium. A monolayer of hydrogen is sorbed to the surface. The second step of the isotherm, between 30 mmHg and 75 mmHg, is where additional hydrogen is absorbed into the palladium and forms palladium hydride. These pressure ranges where gas adsorption occurs are temperature dependent. This specific isotherm is formed when the palladium is heated to 50 ºC. If the sample was at a warmer or cooler temperature, the isotherm would shift right or left, respectively. This pressure-temperature relationship can be seen using the van’t Hoff equation.

Where <delta>H is the enthalpy of the hydride in kJ/mol, <delta>S is the entropy of the hydride in kJ/mol*K, R is the gas constant, 8.314472 J/ (K*mol), T is the temperature in Kelvin, and P (in atmospheres)
is the mean pressure of the second step of the isotherm in atmospheres.
After performing multiple analyses at different temperatures (Figure 2), the isotherm data can be used in conjunction with the van’t Hoff equation to calculate the enthalpy and entropy of the hydride formation, as has been reported by Sandia National Laboratory2. To do so, for each temperature at which the sample was analyzed, the mean pressure of the second step of the isotherm (in atmospheres), and its corresponding temperature (in Kelvin) must be noted. With this data, the logarithm of the pressure is plotted versus the inverse of the temperature and a linear regression can be formed, as seen in Figure 3.
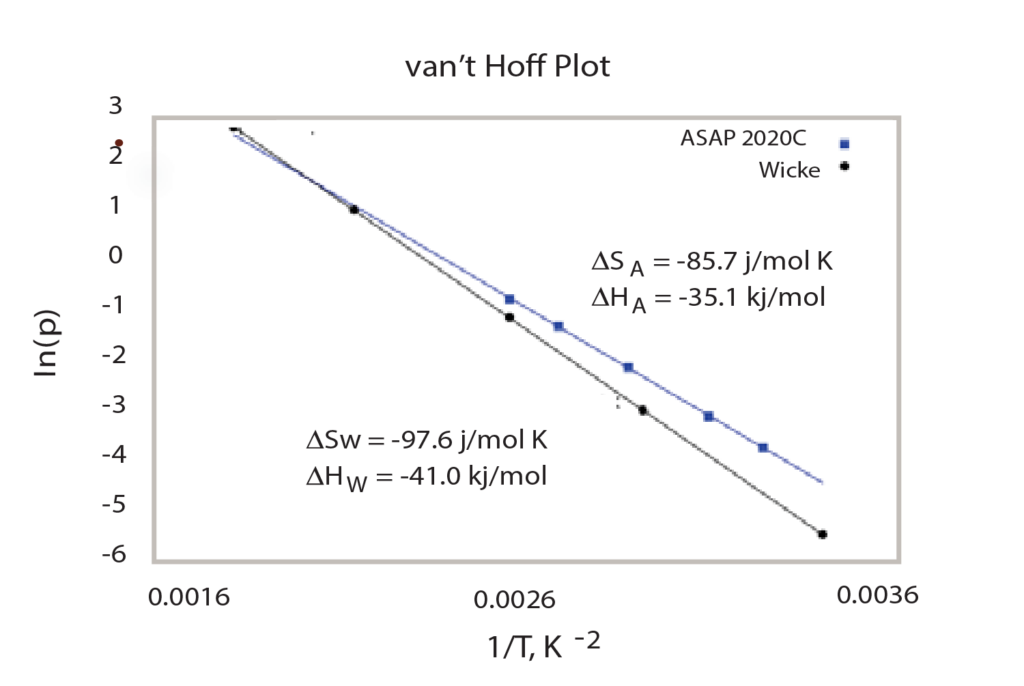
The slope of the line is equal <delta>H/R (the Enthalpy) and the y-intercept is equal to <delta>S/R (Entropy). Once these two values are calculated, the mean pressure at which hydrogen will sorb onto the palladium sample can easily be predicted.
Furthermore, from the temperature and pressure data acquired through the isotherms or through calculation of the van’t Hoff equation, the heat of adsorption (the energy required for adsorption to take place) can be calculated for a specific quantity of gas adsorbed3. This is done using the Clausius- Clapyron equation

or the more commonly employed form:

The Clausius-Clapyron equation provides a convenient technique for determining the isosteric heat of adsorption. When several isotherms are available (Figure 2), a plot of the ln(P) versus 1/T at constant quantity adsorbed provides a linear relationship. The slope of that line is q/R where q is the isosteric heat of adsorption and R is the gas constant. A range of adsorbed quatities may be used to develop a plot of isosteric heat versus coverage as seen in Figure 4.
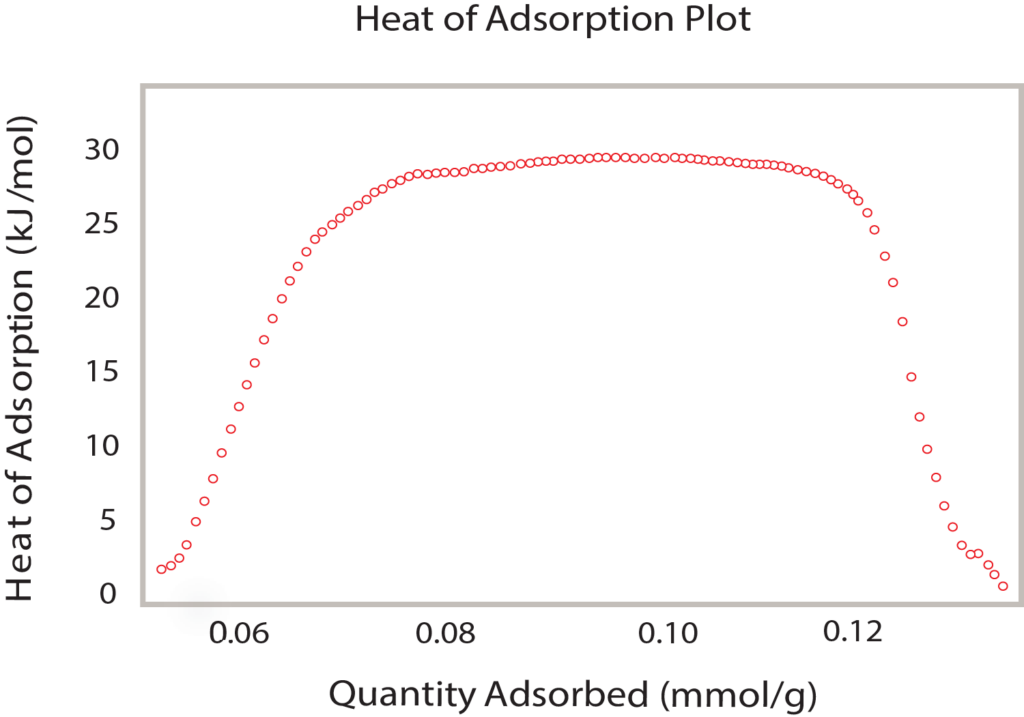
Comparing Figure 3, the van’t Hoff plot vs. Figure 4, the isosteric heat, it is clear the isosteric heat of adsorption provides a detailed analysis of the heat released during the formation of PdHx. The van’t Hoff plot only provides an appropriate or average enthalpy.
Resources
- Webb, Paul A. and Orr, Clyde. Analytical Methods in Fine Particle Technology. Micromeritics Instrument Corp., 1997.
- Sandia National Laboratories Hydride Properties Database.
- Gregg, S. J. The Adsorption of Gases by Solids. New York, N.Y: Chemical Publishing Company, Inc., 1934.