The AutoPore V uses mercury porosimetry that can be used for characterization of Li-ion battery separators and electrodes. This uniquely valuable technique delivers speed, accuracy, and characterization of properties critical to safety, energy density, and longer cycle life. The MicroActive software equips users to interactively evaluate data by allowing them to easily include or exclude data, fit the desired range of experimentally acquired data points using interactive, and move the calculation bars.
This application note will describe a test methodology using the AutoPore V, and its MicroActive software, to characterize the pore structure of a Li-ion battery separator.
Lithium-ion (Li-ion) batteries are an advanced energy storage technology that will play a key role in the trend toward renewable and sustainable industrial solutions involving electrification. They have high energy density, high power density, and long cycle life which has driven the adoption of Li-ion batteries. Separators are an important component within a Li-ion battery that mechanically separates the anode and cathode while allowing maximum ionic conductivity of the Li-ion containing electrolyte. Its design and performance directly affect the capacity, cycle life, and safety performance of the battery.

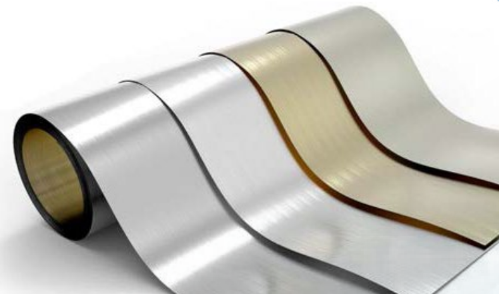
The separator must have sufficient porosity to hold liquid electrolyte, but excessive porosity hinders the ability of the pores to close which shuts down an overheated battery. The pore size must be smaller than the particle size of the electrode components, be uniformly distributed, while also having a tortuous structure. This ensures a uniform current distribution helping to suppress the growth of lithium dendrites on the anode. This application note will demonstrate how the AutoPore, using mercury intrusion, is used to determine both porosity and pore size distribution in an innovative battery separator.
Battery Separator Characterization Technique
The porosity of a separator, also called a diaphragm, is commonly measured directly by the mercury intrusion method, and the porosity result is generally about 40%-60%. Separators are thin films, less than 100 µm thick, and to improve the statistical reliability of the measurement, a test sample consists of several pieces, sized to fit within the sample holder, or penetrometer. However, when the mercury intrusion method is used to test the porosity of the diaphragm, it is likely that mercury will be intruded into gaps between these sample test pieces.
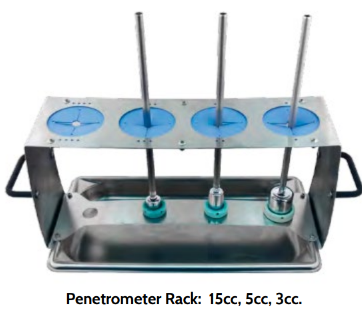
This intrusion into the interstitial space between the sample pieces will appear to indicate the filling of very large pores that are not characteristic of the material. Initially the penetrometer is filled with mercury at a very low pressure so as not to fill any of the pores prior to the start of the analysis.
Since the pressure is increased in small steps so to fill smaller and smaller sized pores, the interstitial space will be filled prior to the filling of actual pores. This will result in an error in the apparent pore volume distribution. This application note will describe a method to identify and eliminate contribution of the interstitial filling to the porosity analysis of the separator.
Understanding the Porosity of Li-ion Battery Separators
When developing new separator designs with unknown pore structure, the pressure range over which intrusion into pores will occur is also not known. In this case, perform an analysis of the separator with a low filling pressure, such as 1.0 psia, which corresponds to approximately 180 µm, per the Washburn equation.
D = -4γcosθ /P
γ=485 dyne/cm (mercury surface tension)
θ=130° (contact angle between mercury and separator)
Cumulative Intrusion and Log Differential Intrusion for Full Mercury Intrusion Results
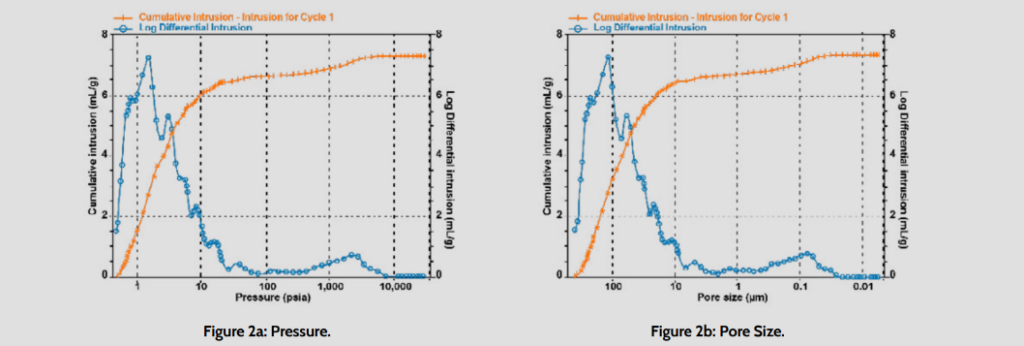
Figures 2a and 2b show the cumulative intrusion and log differential intrusion as a function of applied pressure and pore diameter, respectively, for the separator. For most separators, the pores are typically less than a few hundred nanometers in size. In this example, most of the pore volume appears to be at sizes larger than 10,000 nm (10 µm) with a pore volume of approximately 6 mL/g. This is much larger than is expected for a battery separator diaphragm. Due to the small thickness of the separators, it is necessary to analyze several pieces to obtain statistically relevant pore size distributions. Analyses of the stacked pieces results in apparent porosity that is due to the filling of space between layers of the separator under test. This interstitial volume is not a part of the actual pore volume of the separator.
Looking again at the full analysis results in Figure 2b, there appears to be two regions of apparent pore intrusion, that at pore sizes larger than a few thousand nm and that at pore sizes smaller. Using the MicroActive features of the AutoPore software, the reports can be edited to include only the intrusion representing pore filling. By simply moving range bars using the computer mouse, the range to include can be quickly adjusted, and resulting pore size distribution, as well as densities and porosity, changes are shown in real-time. In addition, material compressibility and pore structure statistics can be adjusted such as tortuosity factor and permeability.
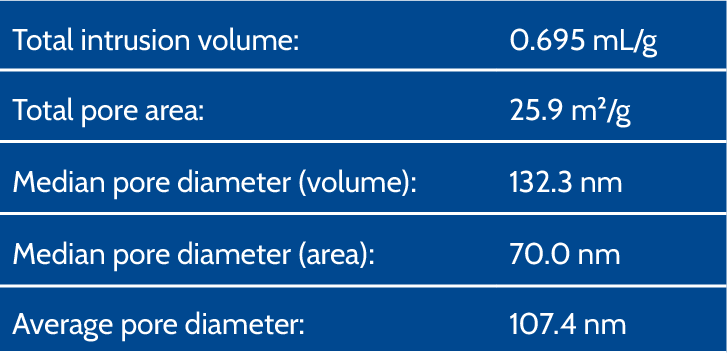
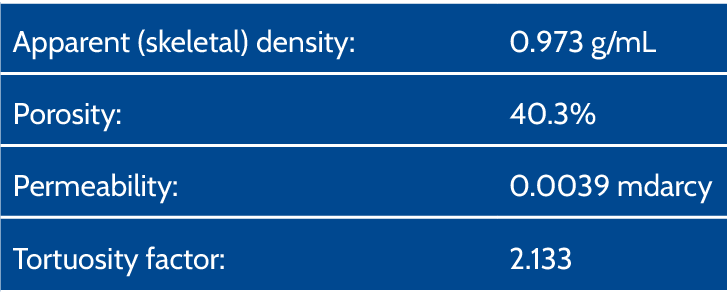
In Figure 3, the report has been edited to exclude intrusion into spaces greater than about 2µm (2000nm). The resulting intrusion summary is shown in Table 1 with a specific pore volume of 0.7 cm³/g, a median pore size of 0.132 µm (132 nm), and a percent porosity of 40%, just as would be expected for a polyethylene lithium battery separator diaphragm, with a resulting calculated tortuosity.
Cumulative Intrusion and Log Differential Intrusion versus Pore Diameter
Edited to remove interstitial filling
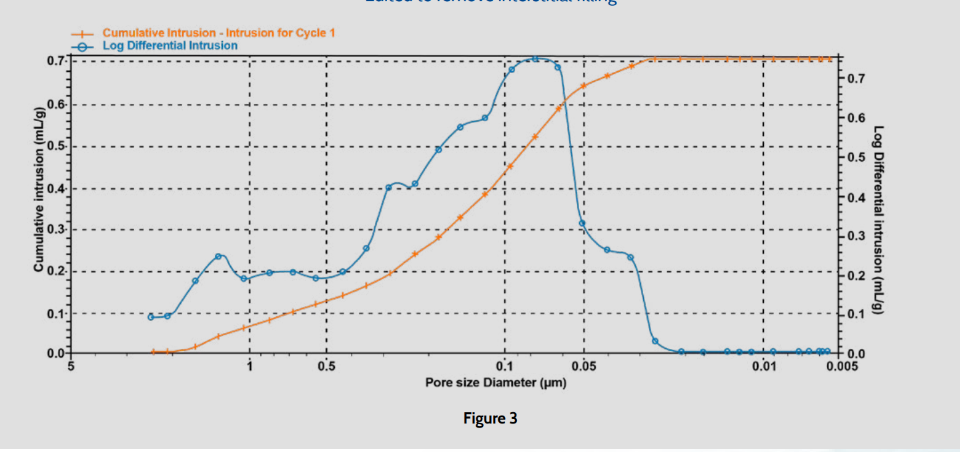
Table 1: Summary after editing to remove interstitial filling.
Intrusion Data & Pore Structure Summary
Verify Result

- Measure skeletal density using an AccuPyc.
- Reciprocal of skeletal density is specific skeletal volume.
- Compare pore volume to specific skeletal volume and should be same order of magnitude.
- Nominal separator porosity 50% (typical 40-60%).
- Therefore, pore volume per gram and true specific skeletal volume are about equal.
- Compare porosity to typical porosity of 40-60%.
Conclusion
Thus, using the MicroActive feature of the AutoPore V software, and a little starting knowledge about what to expect in terms of total porosity of the separator, the pore volume distribution can be optimized to remove interstitial mercury filling even when the region at which it occurs is not known prior to analysis.
The appearance of the cumulative intrusion and log differential plots both help to indicate where the division between interstitial filling and pore filling occurs. The cumulative curve becomes almost flat, and the log differential shows a relative minimum at the same pressure range. The resulting pore volume and percent porosity, based upon the skeletal density of the separator, helps to confirm the selection of the breakpoint between the interstitial and pore filling regions.
This technique can eliminate the false pore information allowing the pore characteristics such as porosity, pore volume, and tortuosity factor to be directly measured.