Introduction
Breakthrough analysis is a powerful technique for determining the adsorption capacity of adsorbent materials under flow conditions. Breakthrough analysis allows users to more closely mimic process conditions than what can be achieved through static adsorption measurements. Additionally, it allows for easy multicomponent measurements when utilizing a mass spectrometer to determine the outlet species from a breakthrough column. Sample preparation is an overlooked, but important step in breakthrough analysis, proper preparation is required to ensure accurate and consistent results.
Prior to breakthrough analysis, samples should be appropriately sized to achieve the best results. Particles that are too large will lead to diffusion limitations within a breakthrough column, while particles that are too small will lead to pressure drop across the column.
Pressure Drop
Pressure drop occurs in a breakthrough column when the gas flow is inhibited by the particles themselves, this results in a lower downstream pressure in the column relative to the upstream pressure. Pressure drop occurs, because the interstitial space between the particles is too small to accommodate the tortuous path that the gas must flow through to reach the outlet of the breakthrough column. Figure 1 below illustrates this effect.


Figure 1. Illustration of particle size and pressure drop across a breakthrough column. Left) Large particles with ample interstitial space for gas to flow. Right) Small particles leaving less interstitial space leading to pressure drop across the breakthrough column.
Pressure drop within a breakthrough column will have negative consequences on the experimental results. The pressure within the column will be inconsistent as it drops from the inlet to the outlet of the column, this inconsistent pressure will lead to inaccurate adsorption capacity calculations. If the pressure upstream of the column becomes too high, it will disrupt the flow of the gas stream and can prevent further gas flow out of the mass flow controllers. Additionally, if the pressure increase upstream of the column becomes too great, it can damage the instrument’s internal components. To eliminate pressure drop within the breakthrough system, steps should be taken to increase the particle size of the sample through pelletization and sieving.
Sample Pelletization
The best procedure to eliminate pressure drop in a breakthrough system is by pelletizing the sample. Pelletization involves subjecting the sample to high pressure, typically using a press, and then using a series of sieves to crush and screen the particles to a consistent size. This will not only help in preventing pressure drop, but will also lead to sharp breakthrough curves since the particles will be similar in size and have consistent interparticle diffusion.
Many samples can withstand the high compression forces needed for pelletization, some samples, however, may degrade or structurally change upon pelletization. There are a few options to prevent pressure drop for materials such as these. First, using a binder material can hold material together that would otherwise crumble or flake. Additionally, dispersing the sample in glass wool or beads can allow for excellent gas flow while also separating the sample particles and preventing pressure drop. When selecting a binder, glass wool, or glass beads it is important to first characterize these materials to determine their adsorptive properties to the adsorbate gas prior to conducting experiments on the sample. After analyzing the binder, glass wool, or glass beads, the sample can be tested and the quantity adsorbed by the sample will be the total quantity adsorbed minus the quantity adsorbed by the binder, glass wool, or glass beads.
Different Limitations
Diffusion limitations within a breakthrough column occur for the opposite reasons as pressure drop. If the particle size is too large, the time that is required for gas molecules to diffuse into the pore space of the material will be greater than the time that is required for breakthrough. This is most prevalent in materials that are highly microporous, where diffusion of the adsorbate gas is slow. Figure 2 below illustrates this effect.

Diffusion limitations within a breakthrough column will lead to a decrease in the calculated adsorption capacity. This occurs because the sample will have broken through, however the pore space has not been completely saturated as the path is too tortuous and requires additional time for diffusion into the small interstitial pores. The onset of diffusion limitations will be present when the breakthrough curve is a gentle slope instead of a sharp peak. Decreasing the particle size will mitigate this effect, however each adsorbent/adsorbate pair will have different diffusion rates. The goal, therefore, is to identify the particle size that will allow for complete diffusion into the sample during the course of a breakthrough experiment.
Case Study
Zeolite 13X was selected as a material to analyze the effects of pressure drop in the SAA 8100 breakthrough analyzer. Zeolite 13X is an aluminosilicate microporous material. It forms a cage structure in the FAU topology. Zeolite 13X has two uniform pores of 13 and 7.5 Å. It is well documented in the literature and was first synthesized by Mobil in the 1950s.
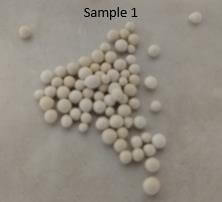
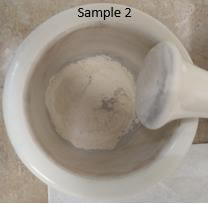
Two samples of Zeolite 13X were prepared for carbon dioxide adsorption experiments at ambient pressure and 30 °C using a 50/50 flow of carbon dioxide and nitrogen. Figure 3 below shows the two samples. Sample 1 is pelletized Zeolite 13X which was analyzed as-is. Sample 2 is pelletized Zeolite 13X that was crushed and sieved to a size less than 40 mesh (0.42 mm). Prior to analysis both samples were activated under nitrogen flow at a flowrate of 20 ml/min, pressure of 1.0 bar, and temperature of 200 °C for 12 hours. Samples were analyzed for carbon dioxide adsorption using flowrates of 7 ml/min nitrogen, 7 ml/min carbon dioxide, and 1 ml/min helium.
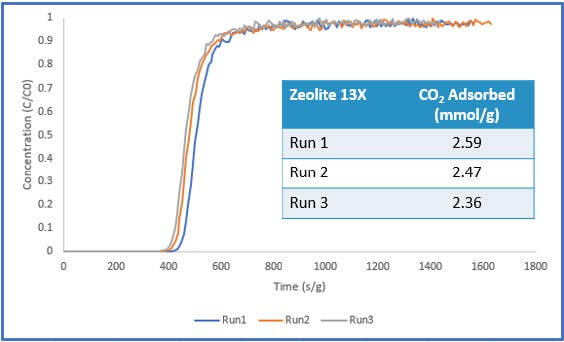
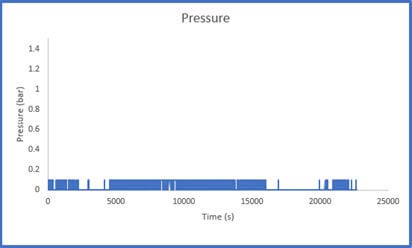
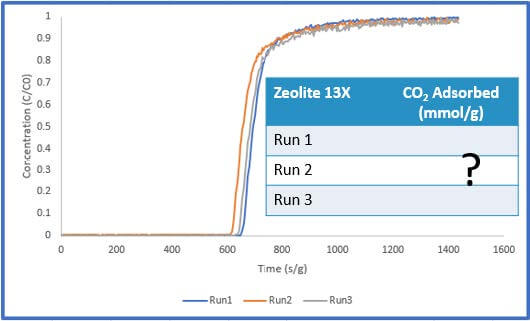
The results of Sample 1 are shown in Figure 4 below. The pelletized sample showed consistent carbon dioxide adsorption performance across three runs. Additionally, the system pressure was stable throughout the experiment, reading atmospheric pressure. These results show that there was little to no pressure drop within the system. Additionally, the steep breakthrough curves imply that mass transfer limitations were not present for this sample.
throughout the breakthrough experiment
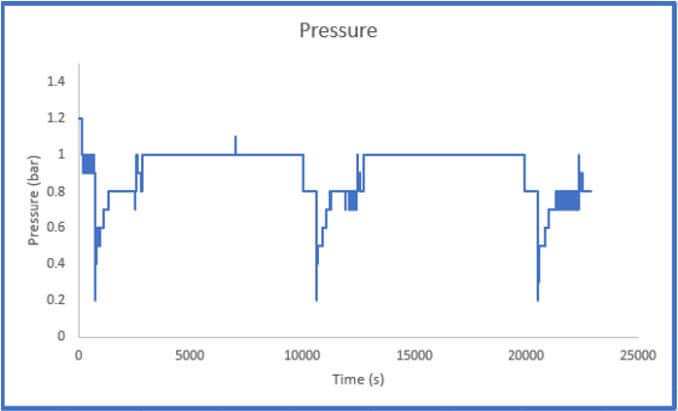
The results of Sample 2 are shown in Figure 5 below. The Crushed Zeolite sample displayed significantly increased system pressure both during sample activation as well as during analysis. The regulator pressure needed to be increased during operation to achieve the desired flowrate of gas through the column. During the sample analysis, the pressure varies considerably, this is a result of low-pressure helium and carbon dioxide mixing with high pressure nitrogen. This disrupts the flow of the gases through the system. While there is little concern regarding mass transfer limitations in the system, it is evident that pressure drop is present.
throughout the breakthrough experiment
It is not possible to calculate a breakthrough adsorption capacity using this data as the system pressure is constantly changing and how the pressure varies across the column is unknown. There could be a small section of the column that is contributing to the majority of the pressure drop that is observed in the system, or the pressure drop could be evenly distributed across the column. If a user observes this pressure trend, they should remove the sample and resize it using the methods described above.
Recommendations
Samples must strike a balance between the particle size being too small, leading to pressure drop, and too large, leading to diffusion limitations. There are several solutions to these problems that are proposed below. In general, there is no one-size-fits-all for particle size and only through further investigation can an ideal particle size be determined for an adsorbate/adsorbent pair.
A summary of the finding in this work are presented below:
- Samples should always be consistently sized to yield the best breakthrough results and the
- sharpest breakthrough curves
- Pressure drop is a problem for samples that consist of fine powders
- A pelletizer and sieves can be used to size particles appropriately. In Micromeritics
testing, a particle size between 10 – 40 Mesh led to good breakthrough results - Some powder samples may require a binder to properly pelletize them
- Glass wool or beads can be used to separate samples that cannot be pelletized or used
with a binder
- A pelletizer and sieves can be used to size particles appropriately. In Micromeritics
- Diffusion limitations are a problem for microporous/nanoporous samples with small pore
windows on-the-order of your adsorbate gas molecule- Diffusion limitations are sample dependent
- Proper sample characterization via BET analysis can determine the pore size distributio