Introduction
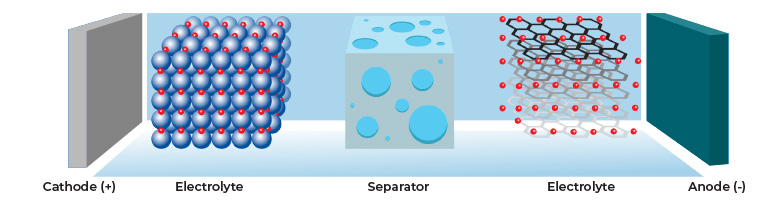
Lithium-ion batteries (LIB) are widely used in consumer electronic devices. They have high energy densities and are rechargeable, resulting in sustained performance across many charging cycles. LIBs consist of an anode, electrolyte, separator, and a cathode, see Figure 1 below. LIBs use a separator, which is a permeable membrane placed between the battery’s anode and cathode. The separator prevents the electrodes from contacting each other. This prevents electrical short-circuits while allowing transport of the ionic charge carriers, completing the circuit and allowing current to flow in the electrochemical cell.
The market for LIBs is expected to grow at a rate of 30% from now until 2030. Apart from consumer electronics, like laptops and cell phones, electric vehicle manufacturers are becoming one of the most significant drivers for growth in LIBs.
The battery separator is a critical component of the LIB. It typically consists of a polymeric membrane forming a porous layer. Apart from chemical and electrochemical stability, the separator should be mechanically strong to withstand the high-tension during battery construction.
The separator has a strong impact on cell performance, battery life, safety, and reliability. Further LIBs for high power applications are increasingly gaining widespread interest; hence it is imperative that industry develops new separators to meet performance, safety, and cost targets.
Characterization Requirements of Battery Separator Research
Pore size of constricted pores, as shown in Figure 2, is an important parameter in the development of battery separators to prevent short circuit between the positive and negative contacts or prevent short circuits caused by burrs, particles, and dendrites that form on the electrodes.
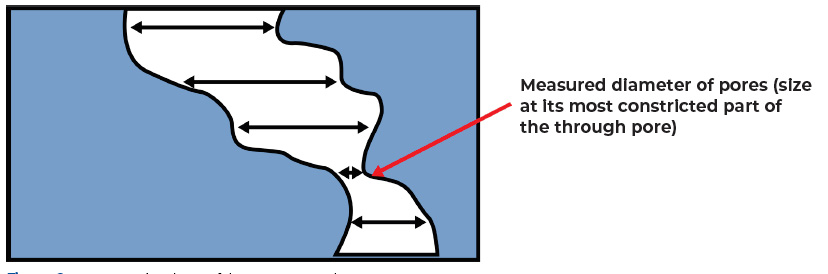
Figure 2. Most Constricted Part of the Pore or Pore Throat
Capillary flow porometry (CFP) and mercury intrusion porosimetry (MIP) can be used to characterize battery separation materials. Both techniques utilize the Washburn Equation to relate pressure to pore size, see equation below.

The difference between the two techniques is that MIP measures both the through pores and blind pores in the material, while CFP only measures the through pores in the material, see figure 3.
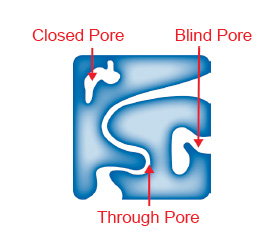
Figure 3. Blind, Through, and Closed Pores
Capillary flow porometry uses a low contact angle wetting solution to fill the pores of a sample. The sample is then subjected to pressurization using a gas, typically nitrogen or air. As the pressure rises, it will reach a critical point where the first air bubble pushes the wetting solution through the pore of the sample. This point is referred to as the bubble point and corresponds to the largest pore in the sample. As the pressure rises, more and more air will pass through the sample leading to the determination of smaller and smaller pores. (see Figure 4)

Figure 4: Principle of capillary flow porometry
The gas pressure is inversely proportional to pore diameter. From capillary flow measurements, characteristics such as largest through pore, through pore size distribution, mean through pore size, and gas permeability can be measured.
MIP utilizes a similar technique, however instead of a wetting solution, it uses mercury and pushes it into the pores of the material. In MIP, there is no flow, so the change in volume as a result of increasing pressure is due to mercury entering the pores of the material. This includes both the through pores, that can also be measured by capillary flow porometry, and the blind pores as shown in Figure 3.
Apart from the pore size of the constricted pores, porosity and pore volume of the separator also give important information regarding separator resistance and battery capacity
Experimental
Two battery separator materials were analyzed on the Micromeritics AccuPore and AutoPore for pore size analysis. The two samples included Celgard 2500 Monolayer and Celgard H2512 Trilayer.
For analysis on the AccuPore, samples were cut into roughly 1-inch by 1-inch squares for analysis on the AccuPore. They were then loaded into the instrument and wetted using GalWik (Galden®PFPE) solution. The cap was then tightened prior to analysis. Both bubble point and full porometry data were collected on the materials. Due to the small pore size, both house air (maximum pressure 100 psi) and a separate high pressure air supply (maximum pressure 500 psi) were needed to achieve the necessary pressure.
For analysis on the AutoPore, roughly 100 mg of sample was loaded into the instrument. The sample was analyzed up to the maximum pressure of 60,000 psi using an equilibration interval of 10 seconds. Intrusion data was then collected back down to a pressure of 30 psi.
Results
Bubble Point Analysis
Bubble point analysis was performed on the Celgard 2500 Monolayer and Celgard H2512 Trilayer membranes using the AccuPore, it is the first step in a capillary flow porometry (CFP) measurement. During the bubble point analysis, the instrument flows gas at a constant rate, which builds pressure over the sample since there is no flow through the pores initially. A graph of pressure versus time will yield a linear relationship at the beginning of the bubble point analysis. When the pressure versus time graph deviates from linearity, the first gas bubbles have passed through the pores of the sample. This corresponds to the bubble point or the largest pore in the sample. The measured bubble points for the two battery separators are shown in Table 1 below.
| Sample | Bubble Point Pressure (psi) | Bubble Point Diameter (μm) |
|---|---|---|
| Celgard 2500 Monolayer | 114.7 | 0.065 |
| Celgard H2512 Trilayer | 161.4 | 0.055 |
Capillary Flow Porometry and Mercury Porosimetry Pore Size
The full CFP results for the Celgard 2500 Monolayer sample are shown in Figure 5 below as well as the distribution of pores that were obtained using the AccuPore (through pores only) and AutoPore (through pores and blind pores).
The full CFP results show the wet curve (blue), the dry curve (orange), and the ½ dry curve (green). The smallest pore (SP) corresponds to the point where the dry curve and wet curve converge. The mean through pore size is at the intersection of the wet curve with the ½ dry curve. The mean through pore for Celgard 2500 Monolayer was 0.065 μm and the smallest pore was found to be 0.059 μm.
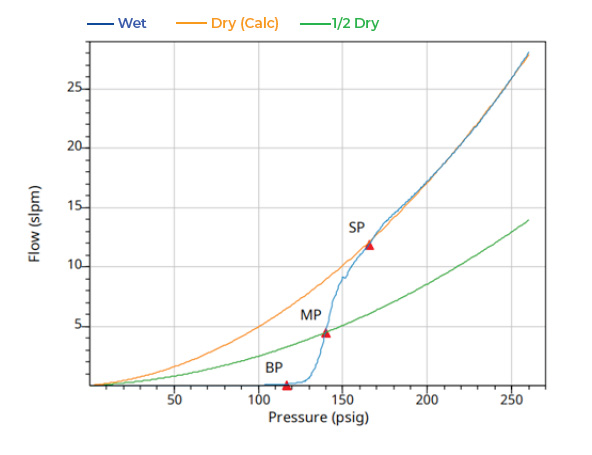
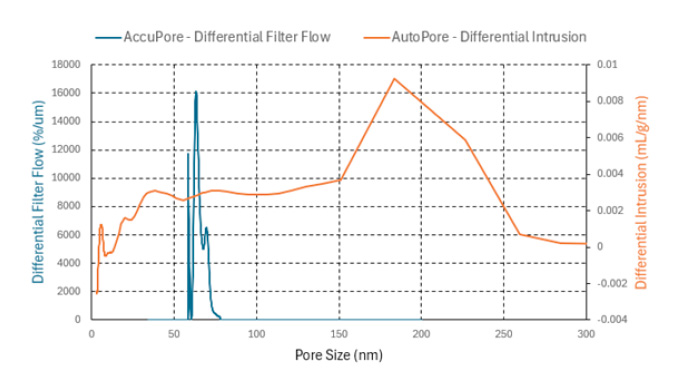
Figure 5: Celgard 2500 Monolayer CFP wet and dry curve data (top) and CFP and MIP pore size data (bottom)
The full CFP results for the Celgard H2512 Trilayer sample are shown in Figure 6 as well as the distribution of pores that were obtained using the AccuPore (through pores only) and AutoPore (through pores and blind pores).
The Celgard H2512 Trilayer sample has a smaller mean through pore size compared to the Celgard 2500 monolayer as well as a narrower through pore size distribution. Additionally, the analysis required greater air pressure to complete the CFP analysis and reach the smallest pore. The mean through pore size of the Celgard H2512 Trilayer sample was 0.049 μm and the smallest pore was found to be 0.044 μm.

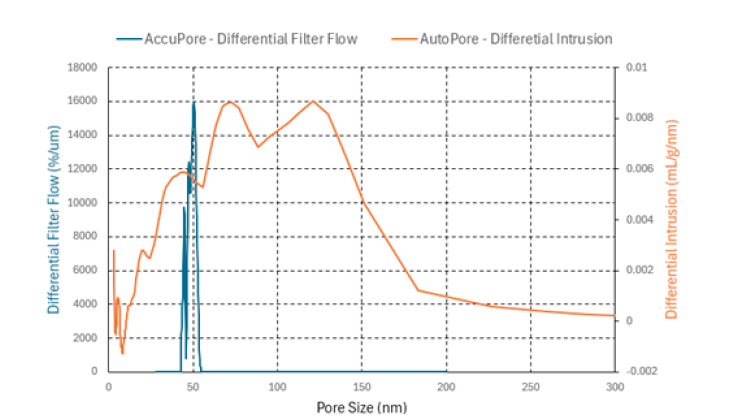
Figure 6: Celgard H2512 Trilayer CFP wet and dry curve data (top) and CFP and MIP pore size data (bottom)
Conclusions
CFP (AccuPore) and MIP (AutoPore) are valuable techniques for understanding the pore structure of battery separator materials. The two techniques measure different material properties. The AccuPore measures only the through pores in the material which is important for understanding the size of particles that can pass through the membrane. The AutoPore measures both the through pores and pores in the material. These techniques allow battery manufacturers to build more stable, longer lasting batteries.


